Research outputs

Selected work

Consulting, Verdel Instruments

2DMS Classification, Modelling, and Simulation

2DMS is a data-independent analysis technique that fragments every precursor in a mixture at once, without chromatographic separation. Each acquisition gives a 2D spectrum that links every product ion to its precursor. I developed statistical methods to classify samples from these spectra, model them, and simulate them.

Challenges

  • Few samples, high dimensionality. Each spectrum has hundreds of millions of dimensions, but as an early technique, we only have access to a limited number of real-world samples.
  • Artefacts. The 2D spectra contain artefacts that bias simple approaches such as thresholding and peak picking. They follow from how the instrument works, so a model can account for them and use the information they carry.
  • Instrument settings differ between runs. Samples run under different settings can differ for that reason alone, not because of their chemistry.
  • No ground truth. The true composition of a real mixture is usually unknown, so there is no reference answer to check a method against.
  • Novel technique. Verdel’s 2026 paper was the first experimental demonstration of 2DMS on a QToF instrument, so there are no established statistical or machine learning models for these data.

Workstreams

Classification

Statistical and machine learning methods that classify samples from their 2D spectra, and match unknown samples to reference samples. A comparison of standard methods, with recommended defaults and experimental designs.

These methods automatically and accurately predict properties such as the country of origin of food samples, including for specimens not used in training.

Modelling

Fitting statistical and machine learning models allows us to account for artefacts in the data, improve the resolving power, identify false peaks, place uncertainty on estimates, and diagnose machine settings in real time.

Simulation

A simulator that generates realistic 2DMS data with known ions, used to test how well processing and peak-detection methods find and separate them.

Learn more about 2DMS here

Consulting, Verdel Instruments

2DMS Software

Each 2DMS sample is a large 2D map. Comparing many samples, for example which ones differ or whether they can be told apart, needed code. So the analysis methods were only available to whoever could write and run that code. To allow for wider use of these methods, I developed a desktop application that lets users load, explore and classify sets of samples without writing code.

Data

Load a set of samples and their labels, derive new labels from existing ones, and choose which samples each analysis uses.

Exploration

Explore samples with PCA, LDA and t-SNE projections, k-means and hierarchical clustering, sample correlation matrices, and per-pixel F-statistic heatmaps.

Classification

Build and validate classifiers step by step, with built-in checks against common validation mistakes such as test data leaking into training.

Custom

Assemble custom analyses from drag-and-drop blocks, including user-written Python.

The application also:

  • Exports figures, tables, and notebooks that reproduce the analysis in standard Python.
  • Runs on Windows and macOS, with automatic updates.
  • Is accompanied by comprehensive analysis to establish best practices and reliable default settings.
  • Connects to the wider Verdel data ecosystem.

Learn more about 2DMS here

Screenshot of the desktop application
Government modelling, Te Pūnaha Matatini and University of Auckland

Official COVID-19 Modelling

During the COVID-19 pandemic, Te Pūnaha Matatini ran a government-funded modelling programme to inform New Zealand’s pandemic response. Its reports went to the Ministry of Health and the Department of the Prime Minister and Cabinet, and fed into decisions on non-pharmaceutical interventions, border controls and vaccination. The team was awarded the 2020 Prime Minister’s Science Prize for this work.

I worked on the programme full time from March 2020 to September 2021, focussed on the real-time modelling programme alongside Professor Shaun Hendy and Professor Michael Plank. This involved:

  • Modelling the spread of infection
  • Writing technical reports for public health and government agencies
  • Presenting the results to officials and policymakers
  • Speaking to the media
  • Publishing in peer-reviewed journals
Modelling

I built and ran stochastic models of COVID-19 spread in New Zealand, to answer policy questions in real time, including:

  • Outbreak models. A stochastic model of COVID-19 spread, used to assess non-pharmaceutical interventions and the chance of elimination as outbreaks were controlled.
  • Border and quarantine. The risk of an outbreak from infected arrivals and border workers under different quarantine and testing policies.
  • Vaccination. The vaccine coverage needed to control outbreaks without other measures, and outbreak outcomes at each stage of the rollout.
  • Equity. Differences in fatality and hospitalisation risk by population demographics.
Outbreak response and communication

Throughout the pandemic, we modelled outbreaks in real time and communicated the results, including:

  • Outbreak modelling. Real-time modelling of the spread of outbreaks, to inform decisions on restrictions.
  • Costs and benefits. Comparing the costs of stricter and lighter restrictions for eliminating an outbreak.
  • Outbreak control. How contact tracing, quarantine, isolation and testing work together to control outbreaks.
  • Government and public health. Technical reports and regular meetings with officials and policymakers.
  • Media. Articles and interviews explaining the modelling to the public.
Reff = 0.5Reff = 0.8Reff = 1.1Without lockdownReported cases

Prime Minister Jacinda Ardern held up a version of this graph at the 30 August 2021 press conference. Daily reported cases in the August 2021 Delta outbreak, from our technical report of 28 August 2021.

See more

The papers, technical reports and media articles from this work are on the research outputs page.

Consulting, GYRE Energy

Real-Time Energy Modelling

Coming soon

DPhil research, University of Oxford

Epidemic Survey Methods

Infection prevalence surveys estimate how many people are infected by testing a random sample of the population. I developed statistical methods for analysing these surveys [1] and worked on REACT-1 [2, 3, 4], which tested over 2.5 million swabs in England during COVID-19.

Statistical research

Daily survey results are noisy, so estimating trends from them requires a statistical model. However, we don’t want our results to be biased by implicit assumptions, and also want our uncertainty estimates to be well-calibrated. A range of such models were built during the pandemic. I stress-tested and improved two of them [5, 6], and compared the outputs with a model free of some of their assumptions [1].

The three models

Smoothing splines

Bayesian P-splines [5] represent the trend as a weighted sum of cubic B-spline basis functions centred on evenly spaced knots. Knot spacing limits how quickly the trend can change.

Fitted with Hamiltonian Monte Carlo in Stan.

Gaussian process

A Gaussian process [6] treats the trend’s values on any set of days as jointly Gaussian, correlated according to a squared-exponential kernel. The lengthscale determines how slowly correlation declines as the time between days increases.

Fitted with Hamiltonian Monte Carlo in Stan using a Hilbert space approximation to the Gaussian process [7].

Hidden-state with SMC

A hidden-state model [1] treats the trend as an unobserved random process. The step size is the standard deviation of the daily change in the trend’s slope.

Fitted with a particle filter inside particle marginal Metropolis–Hastings [8, 9].

REACT-1 swab positivity in England, 5 January to 31 March 2022. Dots are daily positivity with 95% pointwise intervals; the line and band are each model’s estimate with its 95% interval. Data: REACT-1 study, Imperial College London [1, 3].

Findings

Standard noise models are overconfident

The standard (binomial) model assumes that all day-to-day variation comes from sampling. Survey data vary more than that, so the model treats the extra noise as real changes in the trend. On REACT-1 data, its growth-rate estimates swung far more than those from a beta-binomial model [1]. This results in overconfidence in periods of data collection, and underconfidence in projections.

Noise model
Smoothing parameters have real-world interpretations and should be estimated

Smoothing parameters are often hand-picked by the user and ignored, but they have real-world meanings and can (and should) be estimated from the data. In the hidden-state model, the smoothing parameter is the standard deviation of the daily change in the trend’s slope (the parameter slider above) [1]. Estimating this tells us how quickly the growth rate of COVID-19 was changing.

Wildtype
Alpha
Delta
Omicron BA.1
Omicron BA.2
Daily step size00.050.1
Use of statistical theory reduced runtimes substantially

The original splines model did not converge on the full REACT-1 dataset after 31 hours of computation. A better-fitting noise model, combined with architectural changes, reduced this to 39 minutes [1].

With statistical theory, we can fit the same underlying model using a particle filter: with daily knots, the splines model is equivalent to a random walk on the growth rate. This reduced the runtime to 4 minutes [1].

Original splines model31 h+, did not converge
Modified splines model39 min
Hidden-state with SMC4 min
Runtime on the full REACT-1 dataset
Real-time estimates should be in real-time

The splines-based method had to back-out the reproduction number (R) from its model. The additional assumptions involved resulted in estimates running ~1 week behind.

Our new hidden-state model can directly link new infections to prevalence, so can produce estimates in real time [1].

Splines-based methodHidden-state model
Data fusion enhances estimates

Only some positive swabs were genetically sequenced to identify the variant, because sequencing is slow and expensive. Analysing the sequenced swabs on their own throws away most of the data.

Our hidden-state model combines the sequencing results with the test results from every swab, so it can estimate how fast each variant was growing, with greater precision than alternative methods [1].

DeltaOmicron BA.1Omicron BA.2

Applied analysis

REACT-1 collected swab results and questionnaires from over 2 million people in England. Alongside the methods work, I analysed infection trends during the Omicron waves [2], led the analysis of how people’s behaviour changed over the pandemic [4], and co-authored a paper discussing the study’s design [3]. This work involved:

  • Analysis of over 2 million survey responses to identify trends in pandemic-related behaviours [4]
  • Demonstrating that cheaper data can stand in for these expensive data for many modelling use-cases [4]
  • Making these data available for public use (once suitably anonymised). Access these data here.
  • Analysis of sampling and weighting schemes [3].
  • Real-time analysis for national reporting, which also fed into a Science paper [2]

See more

Resources

  • Data portal · R ShinyREACT-1 behaviour data portal

    Aggregated data on pandemic-related behaviours in England.

  • Code · GitHubEpidemicSurveySmoothing

    R, Julia and Stan code for all three models, with example notebooks.

  • Online book · JuliaSMCforRt

    Worked examples fitting epidemic models with sequential Monte Carlo.

References

  1. Steyn, N., Chadeau-Hyam, M., Elliott, P., & Donnelly, C. A. (2025). A Bayesian model for repeated cross-sectional epidemic prevalence survey data. PLOS Computational Biology. https://doi.org/10.1371/journal.pcbi.1013515
  2. Elliott, P., Eales, O., Steyn, N., et al. (2022). Twin peaks: the Omicron SARS-CoV-2 BA.1 and BA.2 epidemics in England. Science. https://doi.org/10.1126/science.abq4411
  3. Elliott, P., Whitaker, M., Tang, D., Eales, O., Steyn, N., et al. (2023). Design and Implementation of a National SARS-CoV-2 Monitoring Program in England: REACT-1 Study. American Journal of Public Health. https://doi.org/10.2105/AJPH.2023.307230
  4. Steyn, N., Chadeau-Hyam, M., Whitaker, M., et al. (2025). Pandemic-risk-related behaviour change in England from June 2020 to March 2022: REACT-1 study among over 2 million people. BMJ Public Health. https://doi.org/10.1136/bmjph-2025-002851
  5. Eales, O., Ainslie, K. E. C., Walters, C. E., et al. (2022). Appropriately smoothing prevalence data to inform estimates of growth rate and reproduction number. Epidemics. https://doi.org/10.1016/j.epidem.2022.100604
  6. Abbott, S., & Funk, S. (2022). Estimating epidemiological quantities from repeated cross-sectional prevalence measurements. medRxiv. https://doi.org/10.1101/2022.03.29.22273101
  7. Riutort-Mayol, G., Bürkner, P.-C., Andersen, M. R., Solin, A., & Vehtari, A. (2023). Practical Hilbert space approximate Bayesian Gaussian processes for probabilistic programming. Statistics and Computing. https://doi.org/10.1007/s11222-022-10167-2
  8. Andrieu, C., Doucet, A., & Holenstein, R. (2010). Particle Markov chain Monte Carlo methods. Journal of the Royal Statistical Society: Series B (Statistical Methodology). https://doi.org/10.1111/j.1467-9868.2009.00736.x
  9. Steyn, N., Parag, K. V., Thompson, R. N., & Donnelly, C. A. (2025). A primer on inference and prediction with epidemic renewal models and sequential Monte Carlo. Statistics in Medicine. https://doi.org/10.1002/sim.70204
DPhil research, University of Oxford

Uncertainty in Epidemiology

Uncertainty is often measured but rarely defined. What does it mean to be uncertain about a made-up quantity? How can we tie it to the real-world decisions it informs?

Defining uncertainty

We developed a first-principles decision-theoretic framework that directly relates uncertainty in epidemic models to real-world practical concerns [1]. The framework is presented as four principles:

Uncertainty arises from making decisions with incomplete information

We treat the modeller’s role as making an estimate aa of some unknown quantity zz, which induces a loss ℓ(a,z)\ell(a,z). We show that the choice of ℓ(a,z)\ell(a,z) defines the measure of uncertainty, while the model defines the missing data.

When planning ICU capacity, each unmet bed costs more than each unused one. With a loss that reflects this, uncertainty about peak demand becomes the expected cost of acting on the best estimate.

The missing data determines how much uncertainty can be reduced

In machine learning, irreducible uncertainty is usually what would remain with unlimited data. An epidemic only happens once, so we instead define the missing data as data that could practically be collected. Uncertainty that these data would remove is reducible, and the rest is irreducible.

When estimating how many people in a town are infected from a sample, the missing data are the untested residents. With a perfect test, all of the uncertainty is reducible. With an imperfect test, some remains even after testing everyone.

Reasoning about the data quantifies reducible uncertainty

The missing data are typically unknown in advance. The chosen model makes implicit assumptions about these, allowing us to quantify the expected uncertainty reduction, and thus estimate the value of collecting more data.

Wastewater samples in New Zealand covered only part of the population. By modelling what samples from the rest might show, we estimated how much more uncertainty full coverage would remove. This allows decision-makers to determine whether there is value in expanding the program.

More data isn’t guaranteed to reduce uncertainty

New data can contradict what has already been observed, thus increasing uncertainty. Ideally, new data would be expected to reduce uncertainty, and we show that coherence (the assumptions in the predictive model match the assumptions in the fitting model) is the required condition.

Existing wastewater sites may have been chosen because they give reliable measurements, so new sites could be noisier. For more data to be expected to reduce uncertainty, this assumption must be built into the model itself, not only into the predictions of new samples.

Case study

We applied this framework to a published model of COVID-19 in New Zealand [2], fitted to reported cases and wastewater data. Fitting the model with and without the wastewater data measured how much uncertainty those data removed. Modelling the samples that were not collected estimated how much more uncertainty sampling the whole population would remove.

We found that wastewater sampling substantially reduced uncertainty in the model on most days, although on a few days (where the wastewater sampling contradicted case data) the uncertainty increased. We also found that the value of expanding the wastewater sampling program would be limited [1].

Reported cases onlyWith observed wastewaterWith full wastewater coverage (expected)

Fixing overconfident and delayed estimates

EpiEstim [3] and EpiFilter [4] are two widely used tools for tracking how fast an epidemic is spreading. Each depends on a smoothing parameter that users usually leave at its default. We developed efficient methods for fitting these from the data, showing marked improvements in calibration and timeliness [5].

We used the fact that the sum of the log one-step-ahead predictive probabilities is equivalent to the model likelihood. Adapting the models to produce one-step-ahead predictions resulted in computationally efficient ways of calculating likelihoods, thus allowing us to find the posterior distribution of the smoothing parameters.

This work improves the robustness and timeliness of existing popular methods.

Coverage of 95% intervals
EpiEstim43%84%
EpiFilter89%93%
0%50%95%
Default smoothingEstimated smoothing
Days behind in detecting changes
EpiEstim9.7 days0.3 days
EpiFilter2.7 days0 days
0 days5 days10 days
Default smoothingEstimated smoothing

See more

Resources

  • Code · GitHubDecisionTheoreticEpi

    Julia and R code for the New Zealand wastewater case study.

  • Code · GitHubRobustRtEstimators

    Julia implementations of EpiEstim and EpiFilter with estimated smoothing, with worked examples.

  • Tutorials · JuliaRobust Rt estimation

    Worked examples of EpiEstim and EpiFilter, including likelihoods and estimated smoothing.

References

  1. Steyn, N., Mills, C., Shirvaikar, V., Bickford Smith, F., Donnelly, C. A., & Parag, K. V. (2026). A decision-theoretic framework for uncertainty quantification in epidemiological modelling. American Journal of Epidemiology. https://doi.org/10.1093/aje/kwag154
  2. Watson, L. M., Plank, M. J., Armstrong, B. A., et al., & Steyn, N. (2024). Jointly estimating epidemiological dynamics of Covid-19 from case and wastewater data in Aotearoa New Zealand. Communications Medicine. https://doi.org/10.1038/s43856-024-00570-3
  3. Cori, A., Ferguson, N. M., Fraser, C., & Cauchemez, S. (2013). A new framework and software to estimate time-varying reproduction numbers during epidemics. American Journal of Epidemiology. https://doi.org/10.1093/aje/kwt133
  4. Parag, K. V. (2021). Improved estimation of time-varying reproduction numbers at low case incidence and between epidemic waves. PLOS Computational Biology. https://doi.org/10.1371/journal.pcbi.1009347
  5. Steyn, N., & Parag, K. V. (2025). Robust uncertainty quantification in popular estimators of the instantaneous reproduction number. American Journal of Epidemiology. https://doi.org/10.1093/aje/kwaf165

DPhil Thesis

My thesis was submitted in September 2025 and my viva (oral exam/defense) took place in November 2025, in which I passed the examination with no corrections. The official copy of my DPhil thesis can be downloaded from the Oxford University Research Archive.

Recent publications

Steyn, N., Mills, C., Shirvaikar, V., Bickford Smith, F., Donnelly C. A., & Parag, K. V. (2026). A decision-theoretic framework for uncertainty quantification in epidemiological modelling. American Journal of Epidemiology. https://doi.org/10.1093/aje/kwag154

Steyn, N., & Parag, K. V. (2025). Robust uncertainty quantification in popular estimators of the instantaneous reproduction number. American Journal of Epidemiology. https://doi.org/10.1093/aje/kwaf165

Steyn, N., Parag, K. V., Thompson, R. N., & Donnelly, C. A. (2025). A primer on inference and prediction with epidemic renewal models and sequential Monte Carlo. Statistics in Medicine. https://doi.org/10.1002/sim.70204

Steyn, N., Chadeau-Hyam, M., Elliott, P., & Donnelly, C. A. (2025). A Bayesian model for repeated cross-sectional epidemic prevalence survey data. PLOS Computational Biology. https://doi.org/10.1371/journal.pcbi.1013515

Steyn, N., Chadeau-Hyam, M., Whitaker, M., et al. (2025). Pandemic-risk-related behaviour change in England from June 2020 to March 2022: REACT-1 study among over 2 million people. BMJ Public Health. https://doi.org/10.1136/bmjph-2025-002851

Steyn, N., Unwin, H. J. T., Ponmattam, J., et al. (2025). Regional and national estimates of children affected by all-cause and COVID-19-associated orphanhood and caregiver death in Brazil, by age and family circumstance. The Lancet Regional Health Americas. https://doi.org/10.1016/j.lana.2025.101252

A complete list of publications can be found lower on this page.

Talks and posters

Bioinference 2025 talk
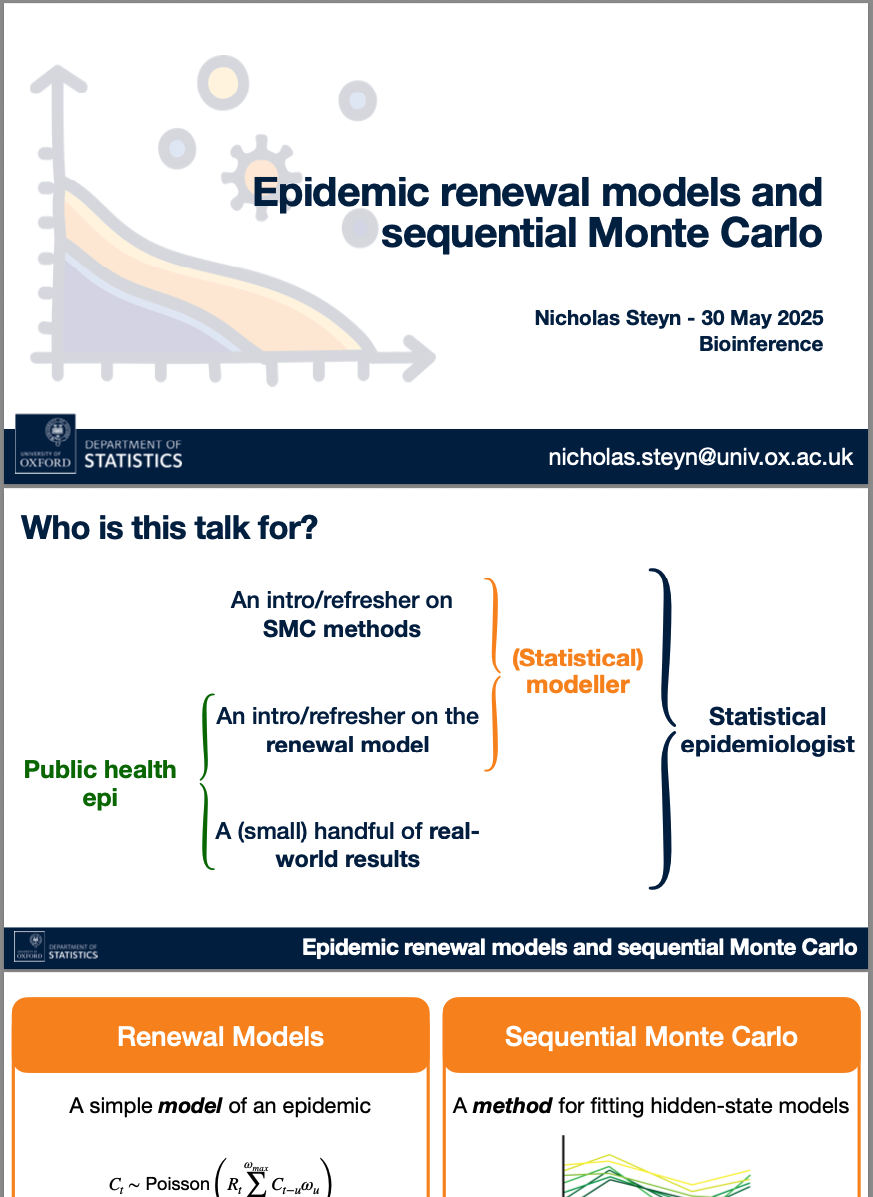
Presented at Bioinference 2025. Download here. I was awarded the best talk by an ECR for this presentation.
IDM 2024 poster
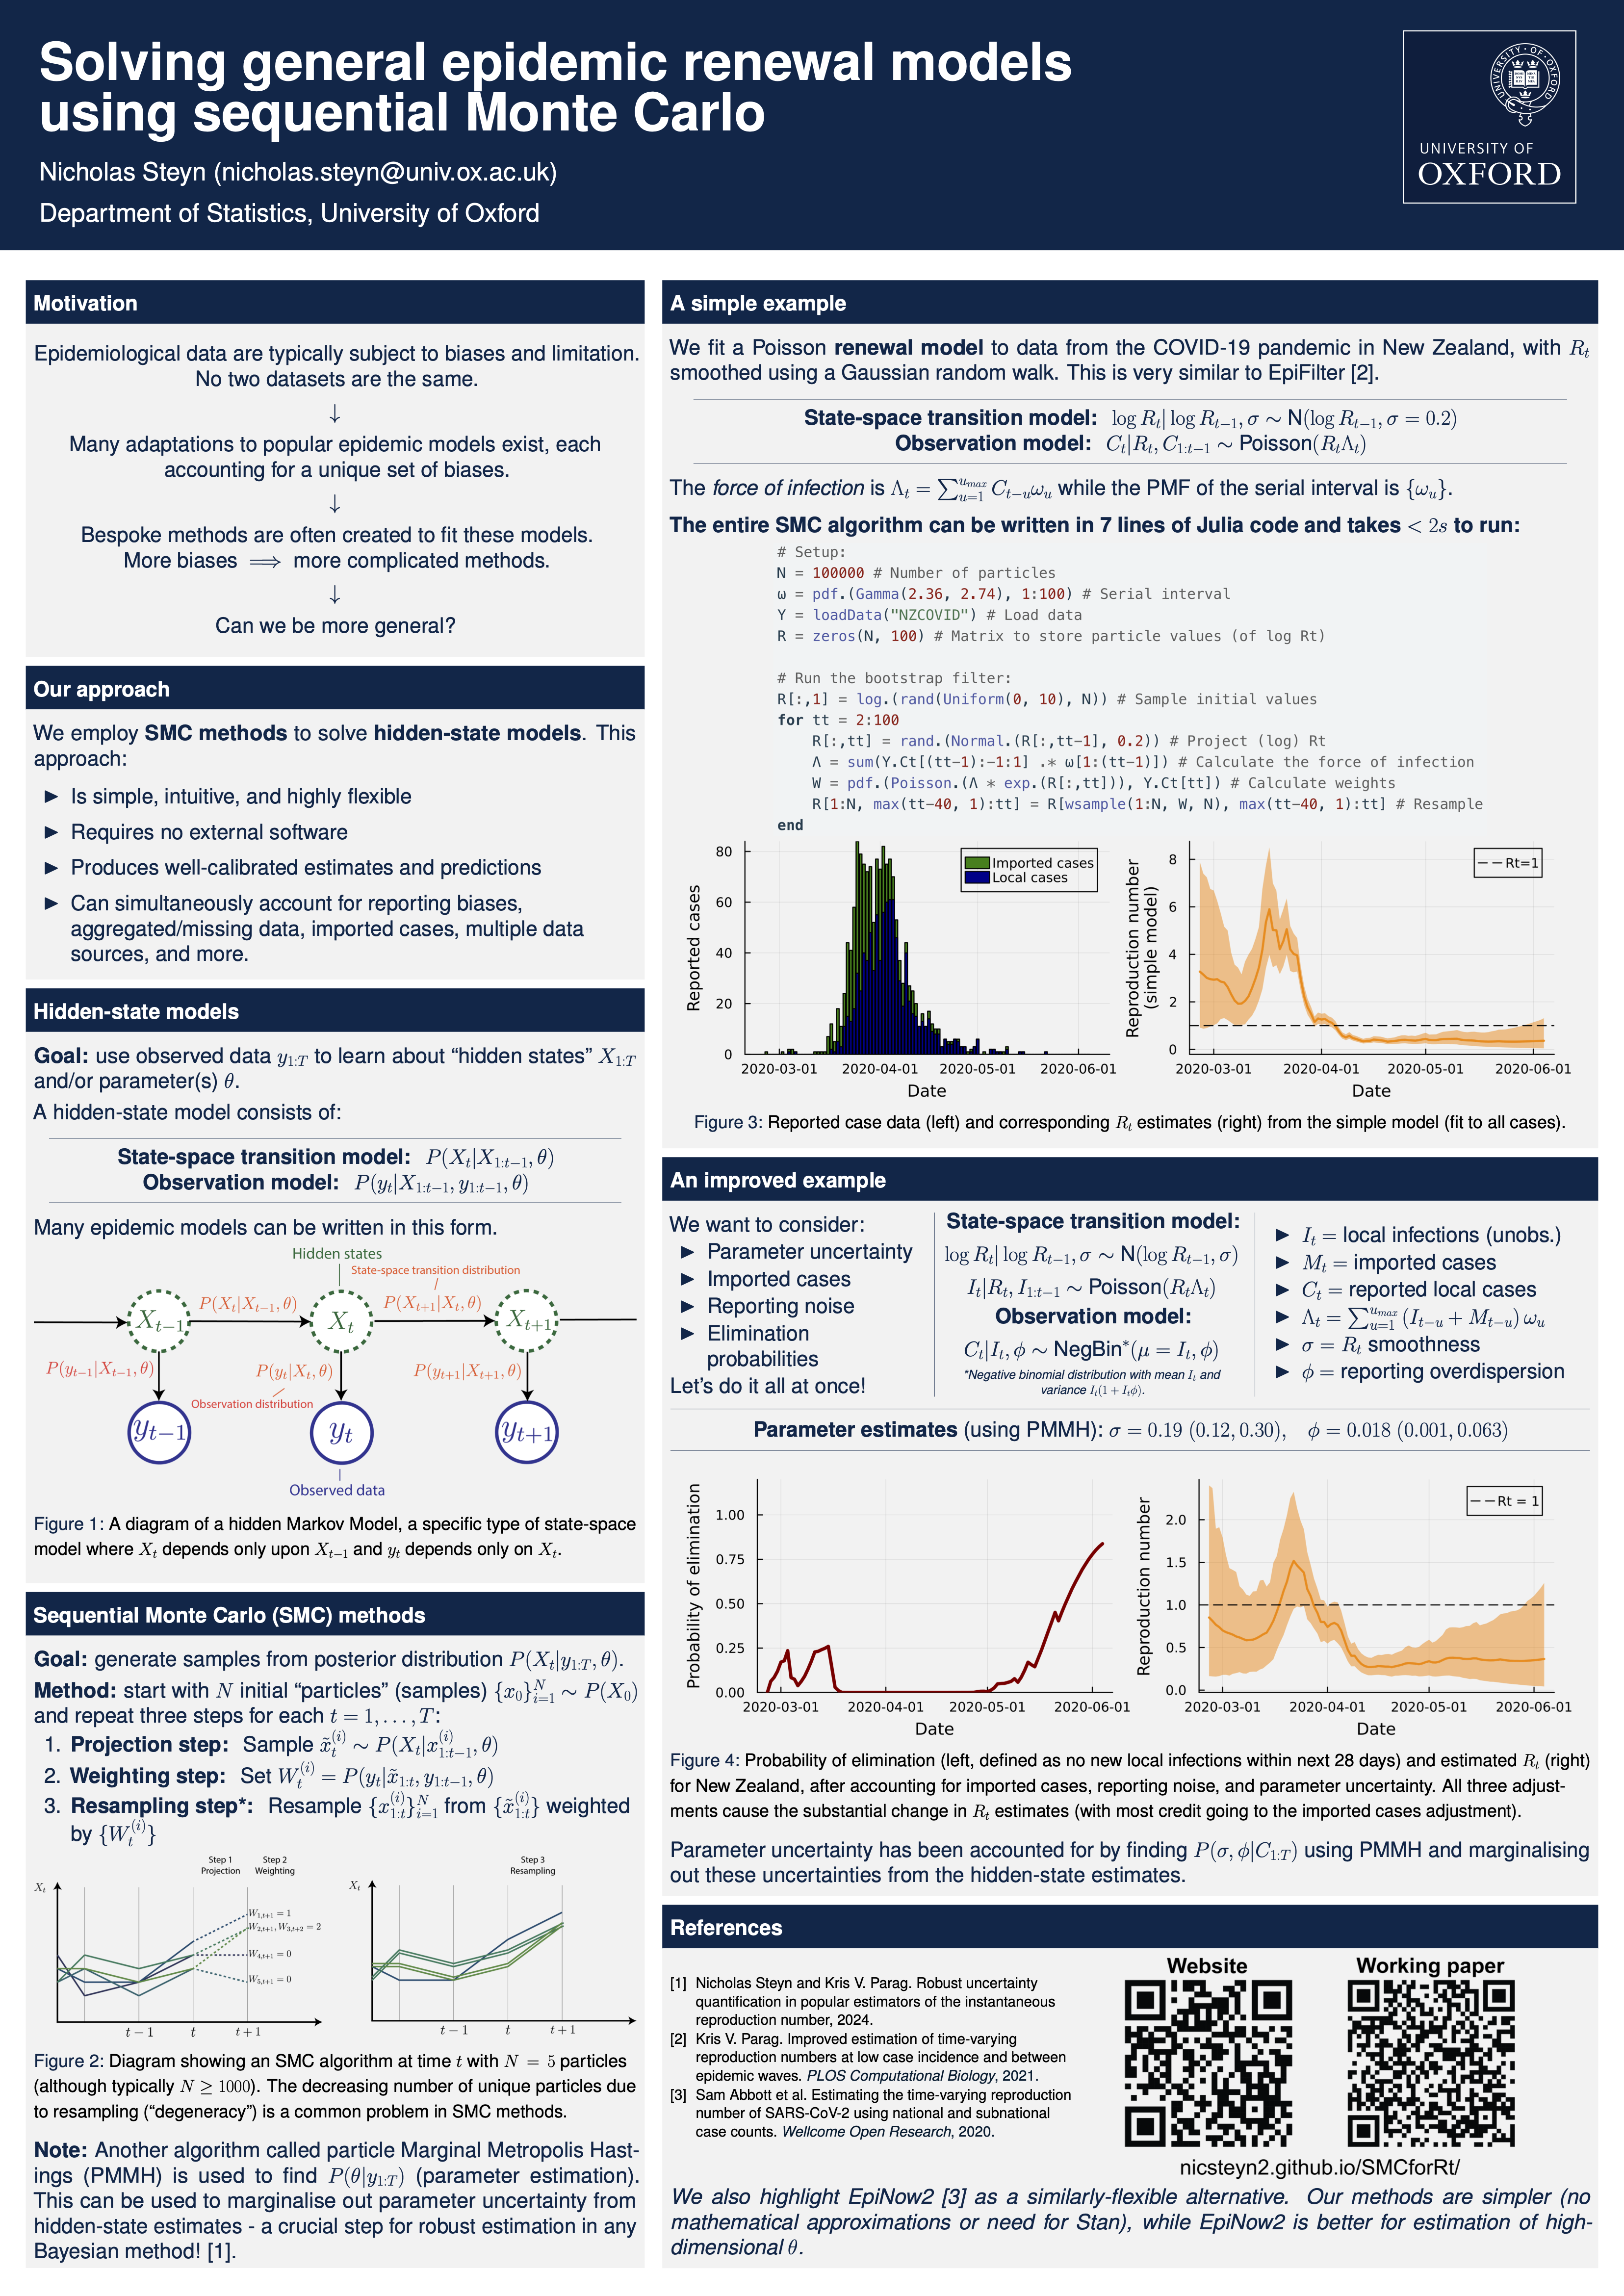
Presented at IDM 2024. Download here.
EPIDEMICS 2023 poster
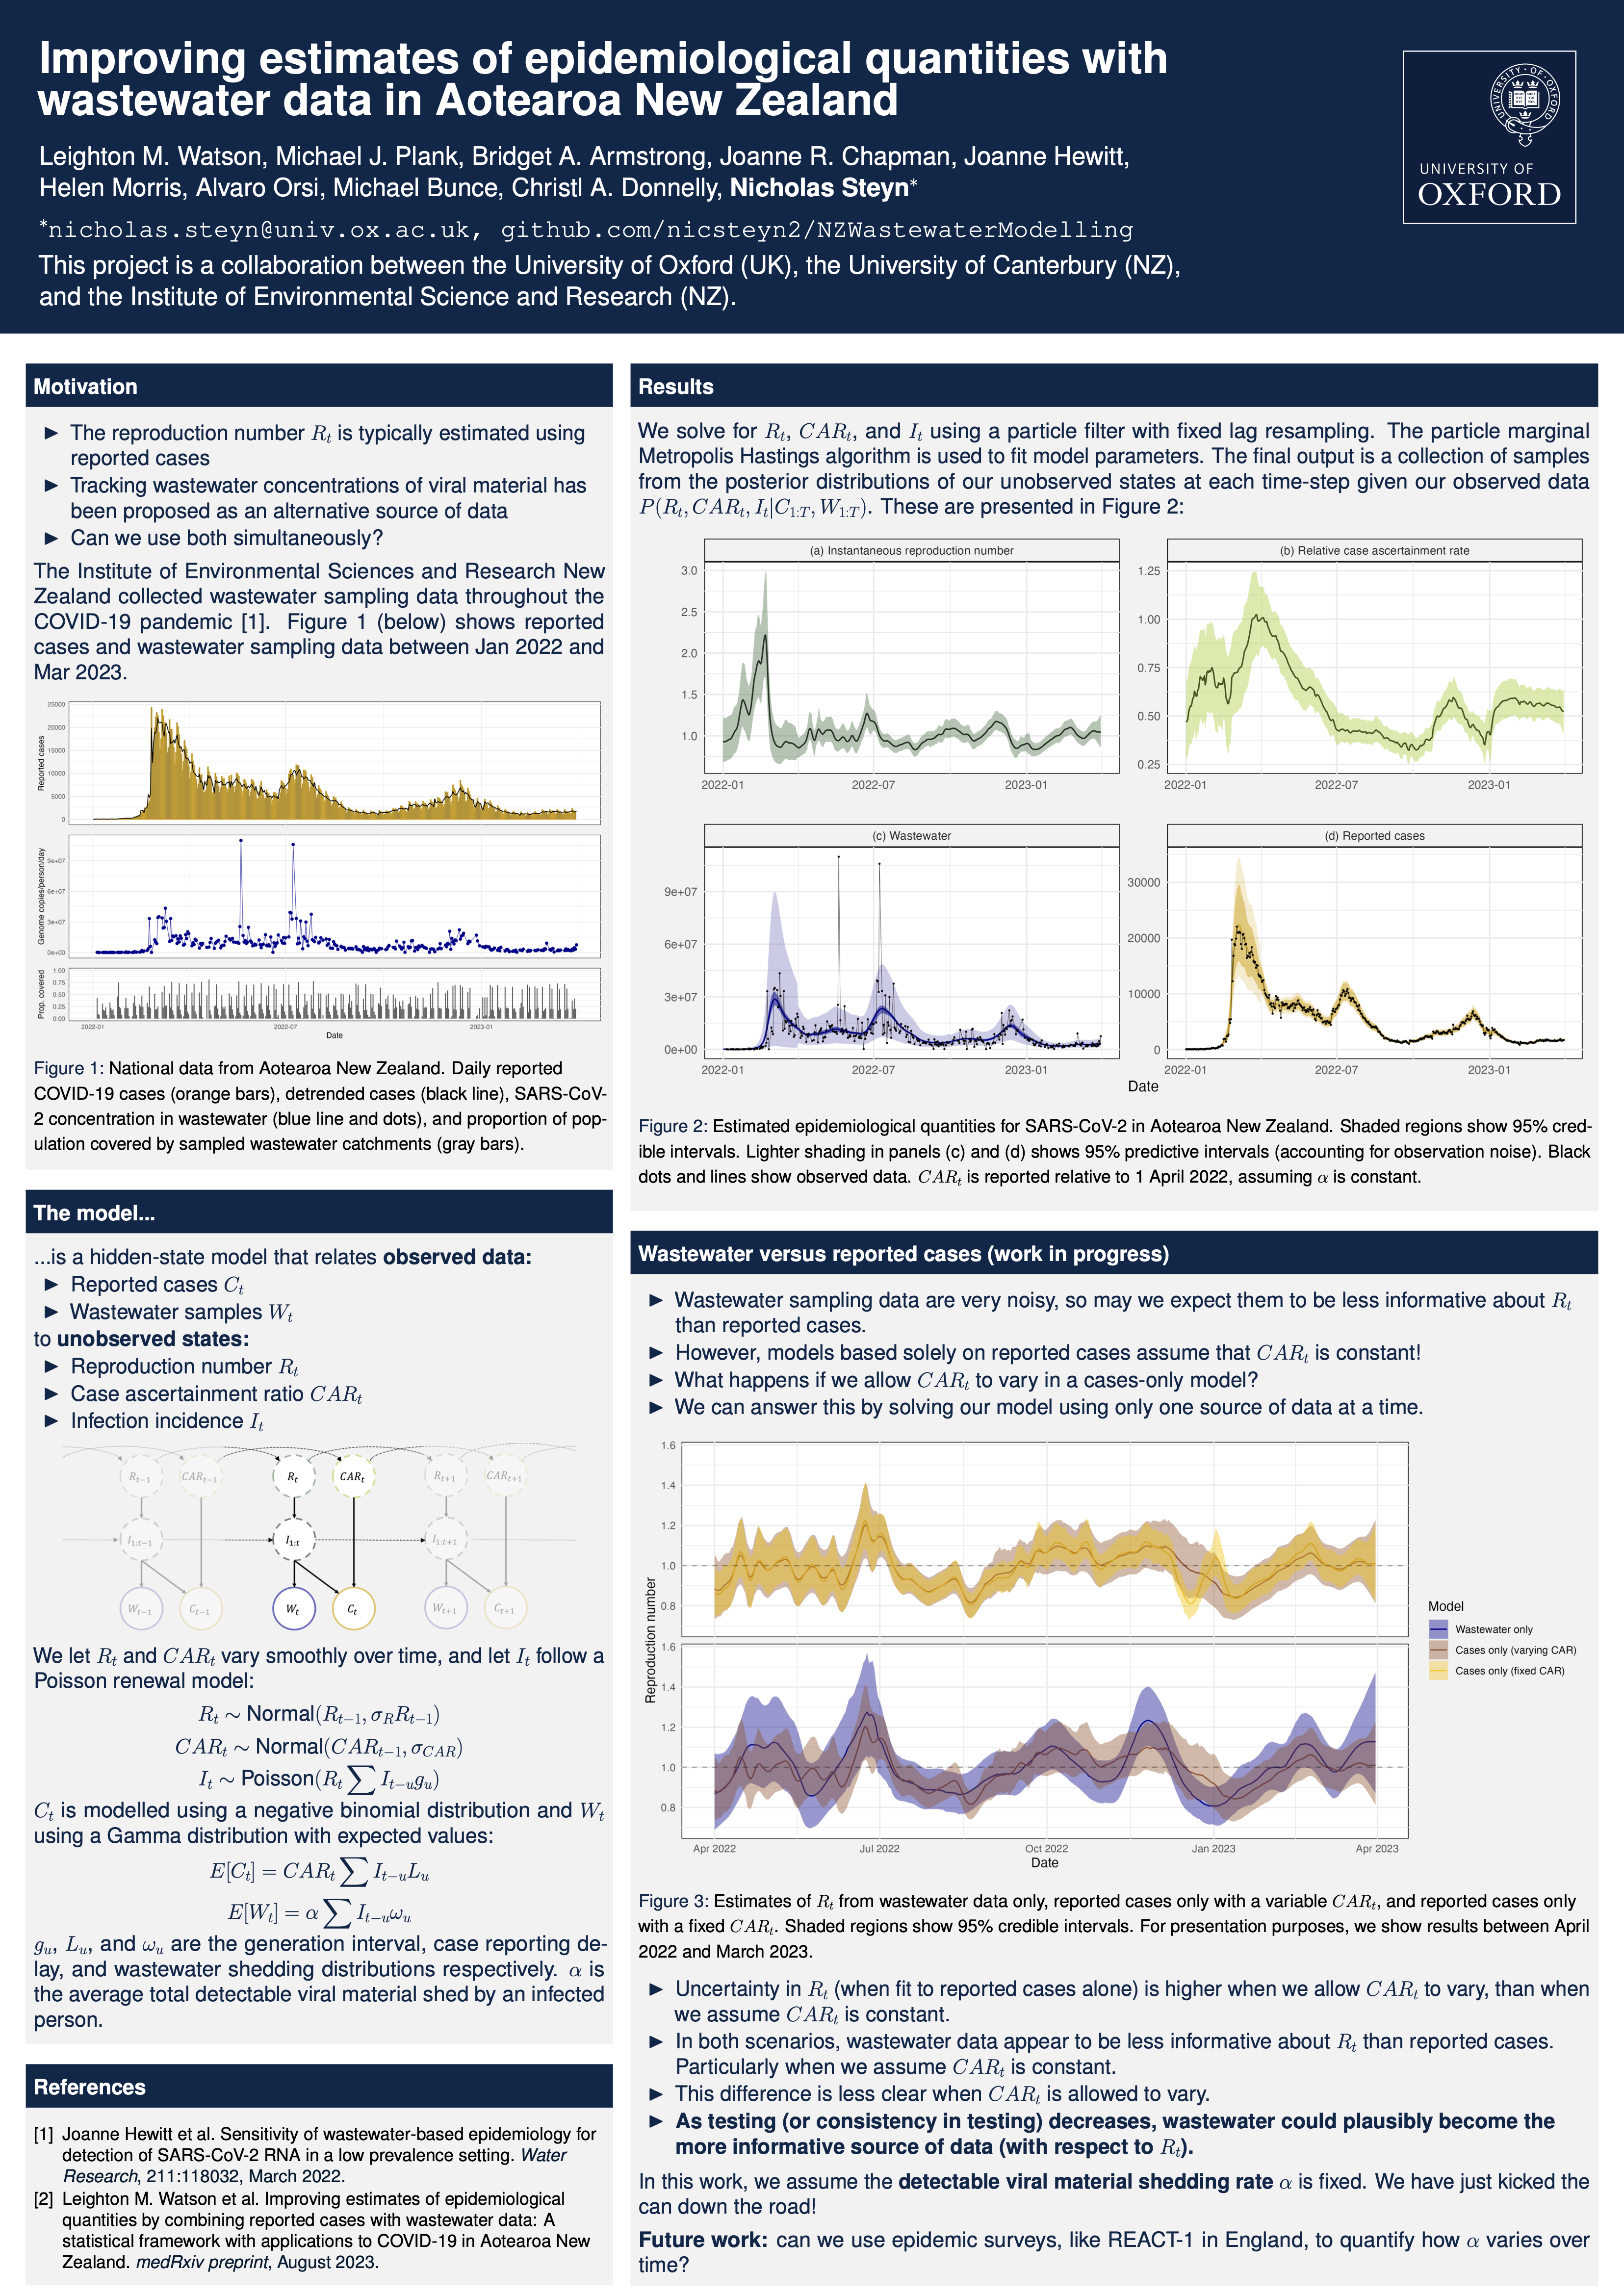
Presented at EPIDEMICS 2023. Download here.

Online resources

SMC and epidemic renewal models: an online “book” demonstrating sequential Monte Carlo methods for fitting epidemic renewal models. Accompanies A primer on inference and prediction with epidemic renewal models using sequential Monte Carlo methods.

Rt estimators in Julia: short vignettes accompanying the code provided in the GitHub repository for Robust uncertainty quantification in popular estimators of the instantaneous reproduction number. Provides Julia implementation of EpiEstim and EpiFilter, as well as the corresponding parameter fitting methodology developed in the paper.

Pandemic-risk-related behavioural data portal: an R shiny server hosting a large quantity of aggregated data on pandemic-risk-related behaviours in England, collected as part of the REACT-1 study. By making these data publicly available, we hope to enable further research. Methodology can be found in our preprint.

Publications

2026

Steyn, N., Mills, C., Shirvaikar, V., Bickford Smith, F., Donnelly C. A., & Parag, K. V. (2026). A decision-theoretic framework for uncertainty quantification in epidemiological modelling. American Journal of Epidemiology. https://doi.org/10.1093/aje/kwag154

Ogi-Gittins, I., Steyn, N., Kaye, A. R., Hill, E. M., & Thompson, R. N. (2026). Robust estimation of the time-dependent reproduction number in the presence of weekend reporting effects. BMC Global and Public Health. https://doi.org/10.1186/s44263-026-00280-z.

2025

Steyn, N., & Parag, K. V. (2025). Robust uncertainty quantification in popular estimators of the instantaneous reproduction number. American Journal of Epidemiology. https://doi.org/10.1093/aje/kwaf165

Steyn, N., Parag, K. V., Thompson, R. N., & Donnelly, C. A. (2025). A primer on inference and prediction with epidemic renewal models and sequential Monte Carlo. Statistics in Medicine. https://doi.org/10.1002/sim.70204

Steyn, N., Chadeau-Hyam, M., Elliott, P., & Donnelly, C. A. (2025). A Bayesian model for repeated cross-sectional epidemic prevalence survey data. PLOS Computational Biology. https://doi.org/10.1371/journal.pcbi.1013515

Steyn, N., Chadeau-Hyam, M., Whitaker, M., et al. (2025). Pandemic-risk-related behaviour change in England from June 2020 to March 2022: REACT-1 study among over 2 million people. BMJ Public Health. https://doi.org/10.1136/bmjph-2025-002851

Steyn, N., Unwin, H. J. T., Ponmattam, J., et al. (2025). Regional and national estimates of children affected by all-cause and COVID-19-associated orphanhood and caregiver death in Brazil, by age and family circumstance. The Lancet Regional Health Americas. https://doi.org/10.1016/j.lana.2025.101252

Ogi-Gittins, I., Steyn, N., Polonsky, J., Hart, W. S., Keita, M., Ahuka-Mundeke, S., Hill, E. M., & Thompson, R. N. (2025). Simulation-based inference of the time-dependent reproduction number from temporally aggregated and under-reported disease incidence time series data. Philosophical Transactions of the Royal Society A. http://doi.org/10.1098/rsta.2024.0412

2024

Watson, L. M., Plank, M. J., Armstrong, B. A., Chapman, J. R., Hewitt, J., Morris, H., Orsi, A., Bunce, M., Donnelly, C. A., & Steyn, N. (2024). Jointly estimating epidemiological dynamics of Covid-19 from case and wastewater data in Aotearoa New Zealand. Communications Medicine. https://doi.org/10.1038/s43856-024-00570-3

2023

Binny, R. N., Priest, P., French, N. P., Parry, M., Lustig, A., Hendy, S. C., Maclaren, O. J., Ridings, K. M., Steyn, N., Vattiato, G., & Plank, M. J. (2023). Sensitivity of Reverse Transcription Polymerase Chain Reaction Tests for Severe Acute Respiratory Syndrome Coronavirus 2 Through Time. The Journal of Infectious Diseases. https://doi.org/10.1093/infdis/jiac317

Elliott, P., Whitaker, M., Tang, D., Eales, O., Steyn, N., Bodinier, B., Wang, H., Elliott, J., Atchison, C., Ashby, D., Barclay, W., Taylor, G., Darzi, A., Cooke, G. S., Ward, H., Donnelly, C. A., Riley, S., & Chadeau-Hyam, M. (2023). Design and Implementation of a National SARS-CoV-2 Monitoring Program in England: REACT-1 Study. American Journal of Public Health. https://doi.org/10.2105/AJPH.2023.307230

2022

Elliott, P., Eales, O., Steyn, N., Tang, D., Bodinier, B., Wang, H., Elliott, J., Whitaker, M., Atchison, C., Diggle, P. J., Page, A. J., Trotter, A. J., Ashby, D., Barclay, W., Taylor, G., Ward, H., Darzi, A., Cooke, G. S., Donnelly, C. A., & Chadeau-Hyam, M. (2022). Twin peaks: the Omicron SARS-CoV-2 BA. 1 and BA. 2 epidemics in England. Science. https://doi.org/10.1126/science.abq4411

Plank, M. J., James, A., Lustig, A., Steyn, N., Binny, R. N., & Hendy, S. C. (2022). Potential reduction in transmission of COVID-19 by digital contact tracing systems: a modelling study. Mathematical Medicine and Biology. https://doi.org/10.1093/imammb/dqac002

Steyn, N., Lustig, A., Hendy, S. C., Binny, R. N., & Plank, M. J. (2022). Effect of vaccination, border testing, and quarantine requirements on the risk of COVID-19 in New Zealand: A modelling study. Infectious Disease Modelling. https://doi.org/10.1016/j.idm.2021.12.006

Steyn, N., Plank, M. J., Binny, R. N., Hendy, S. C., Lustig, A., & Ridings, K. (2022). A COVID-19 vaccination model for Aotearoa New Zealand. Scientific Reports https://doi.org/10.1038/s41598-022-06707-5

2021

Hendy, S., Steyn, N., James, A., Plank, M. J., Hannah, K., Binny, R. N., & Lustig, A. (2021). Mathematical modelling to inform New Zealand’s COVID-19 response. Journal of the Royal Society of New Zealand. https://doi.org/10.1080/03036758.2021.1876111

James, A., Plank, M. J., Hendy, S., Binny, R., Lustig, A., Steyn, N., Nesdale, A., & Verrall, A. (2021). Successful contact tracing systems for COVID-19 rely on effective quarantine and isolation. PLoS One. https://doi.org/10.1371/journal.pone.0252499

Steyn, N., Binny, R. N., Hannah, K., Hendy, S., James, A., Lustig, A., Ridings, K., Plank, M. J., & Sporle, A. (2021). Māori and Pacific People in New Zealand have higher risk of hospitalisation for COVID-19. New Zealand Medical Journal. Link to PDF

James, A., Plank, M. J., Binny, R. N., Lustig, A., Hannah, K., Hendy, S. C., & Steyn, N. (2021). A structured model for COVID-19 spread: modelling age and healthcare inequities. Mathematical Medicine and Biology. https://doi.org/10.1093/imammb/dqab006

Binny, R. N., Baker, M. G., Hendy, S. C., James, A., Lustig, A., Plank, M. J., Ridings, K. M., & Steyn, N. (2021). Early intervention is the key to success in COVID-19 control. Royal Society Open Science. https://doi.org/10.1098/rsos.210488

Steyn, N., Plank, M. J., James, A., Binny, R. N., Hendy, S. C., & Lustig, A. (2021). Managing the risk of a COVID-19 outbreak from border arrivals. Journal of the Royal Society Interface. https://doi.org/10.1098/rsif.2021.0063

Plank, M., James, A., & Steyn, N. (2021). Comment: weekly COVID-19 testing with household quarantine and contact tracing is feasible and would probably end the epidemic. Royal Society Open Science. https://doi.org/10.1098/rsos.201546

James, A., Plank, M. J., Hendy, S., Binny, R. N., Lustig, A., & Steyn, N. (2021). Model-free estimation of COVID-19 transmission dynamics from a complete outbreak. PLOS ONE. https://doi.org/10.1371/journal.pone.0238800

2020

Steyn, N., Binny, R. N., Hannah, K., Hendy, S., James, A., Kukutai, T., Lustig, A., McLeod, M., Plank, M. J., Ridings, K., & Sporle, A. (2020). Estimated inequities in COVID-19 infection fatality rates by ethnicity for Aotearoa New Zealand. New Zealand Medical Journal. Link to PDF

Technical reports

Steyn, N., Plank, M. J., & Hendy, S. C. (2021). Modelling to support a future COVID-19 strategy for Aotearoa New Zealand. Link to PDF

Steyn, N., Hendy, S., Plank, M., & Binny, R. (2021). Technical report: modelling the potential spread of COVID-19 during the August 2021 outbreak. Link to PDF

James, A., Binny, R. N., Hendy, S. C., Lustig, A., Steyn, N., & Plank, M. J. (2020). Economic comparison of the use of Alert Levels 3 and 4 in eliminating the Auckland August outbreak: a cost-effectiveness analysis 21 October 2020. Link to PDF

Binny, R. N., Hendy, S. C., James, A., Lustig, A., Plank, M. J., & Steyn, N. (2020). Probability of elimination for COVID-19 in Aotearoa New Zealand. https://doi.org/10.1101/2020.08.10.20172361

Binny, R. N., Lustig, A., Brower, A., Hendy, S. C., James, A., Parry, M., Plank, M. J., & Steyn, N. (2020). Effective reproduction number for COVID-19 in Aotearoa New Zealand. https://doi.org/10.1101/2020.08.10.20172320

Binny, R. N., Hendy, S. C., James, A., Lustig, A., Plank, M. J., & Steyn, N. (2020). Effect of Alert Level 4 on Reff: review of international COVID-19 cases. https://doi.org/10.1101/2020.04.30.20086934

Plank, M. J., Binny, R. N., Hendy, S. C., Lustig, A., James, A., & Steyn, N. (2020). A stochastic model for COVID-19 spread and the effects of Alert Level 4 in Aotearoa New Zealand. https://doi.org/10.1101/2020.04.08.20058743

James, A., Hendy, S. C., Plank, M. J., & Steyn, N. (2020). Suppression and mitigation strategies for control of COVID-19 in New Zealand. https://doi.org/10.1101/2020.03.26.20044677

Media

Steyn, N., & Plank, M. J. Why strict border control remains crucial if we want to keep the travel bubble safe. The Conversation. 21 April 2021. Link

Plank, M. J., James, A., Steyn, N., & Hendy, S. C. Auckland’s rapid lockdown has given New Zealand a better chance of eliminating coronavirus – again. The Conversation. 28 August 2020. Link

Steyn, N., Plank, M. J., James, A., Binny, R. N., Lustig, A., & Hendy, S. C. A critical error in a report on lockdown timing risks undermining future decisions. The Spinoff. 10 August 2020. Link

Plank, M. J., James, A., Lustig, A., Steyn, N., Binny, R. N., & Hendy, S. C. A new community case of COVID-19 in New Zealand is a matter of when, not if. Is the country prepared for it? The Conversation. 10 August 2020. Link

Plank, M. J., James, A., Lustig, A., Steyn, N., Binny, R. N., & Hendy, S. C. How New Zealand could keep eliminating coronavirus at its border for months to come, even as the global pandemic worsens. The Conversation. 16 July 2020. Link

Plank, M. J., James, A., Lustig, A., Steyn, N., Binny, R. N., & Hendy, S. C. 2 new COVID-19 cases in New Zealand, but elimination of community transmission still stands. The Conversation. 16 June 2020. Link

Plank, M. J., James, A., Lustig, A., Steyn, N., Binny, R. N., & Hendy, S. C. New Zealand hits a 95% chance of eliminating coronavirus – but we predict new cases will emerge. The Conversation. 4 June 2020. Link

Awards

Prime Minister’s Science Prize. 2020. Awarded for a “transformative scientific discovery or achievement” with a significant impact on New Zealand. This was awarded for our work on modelling during the COVID-19 pandemic in New Zealand.